Adjusted Net Revenue up 37% to a record $1.0 billion
Adjusted EBITDA up 60% to a record $318 million
Fee-based Revenue up 53% to a record $443 million
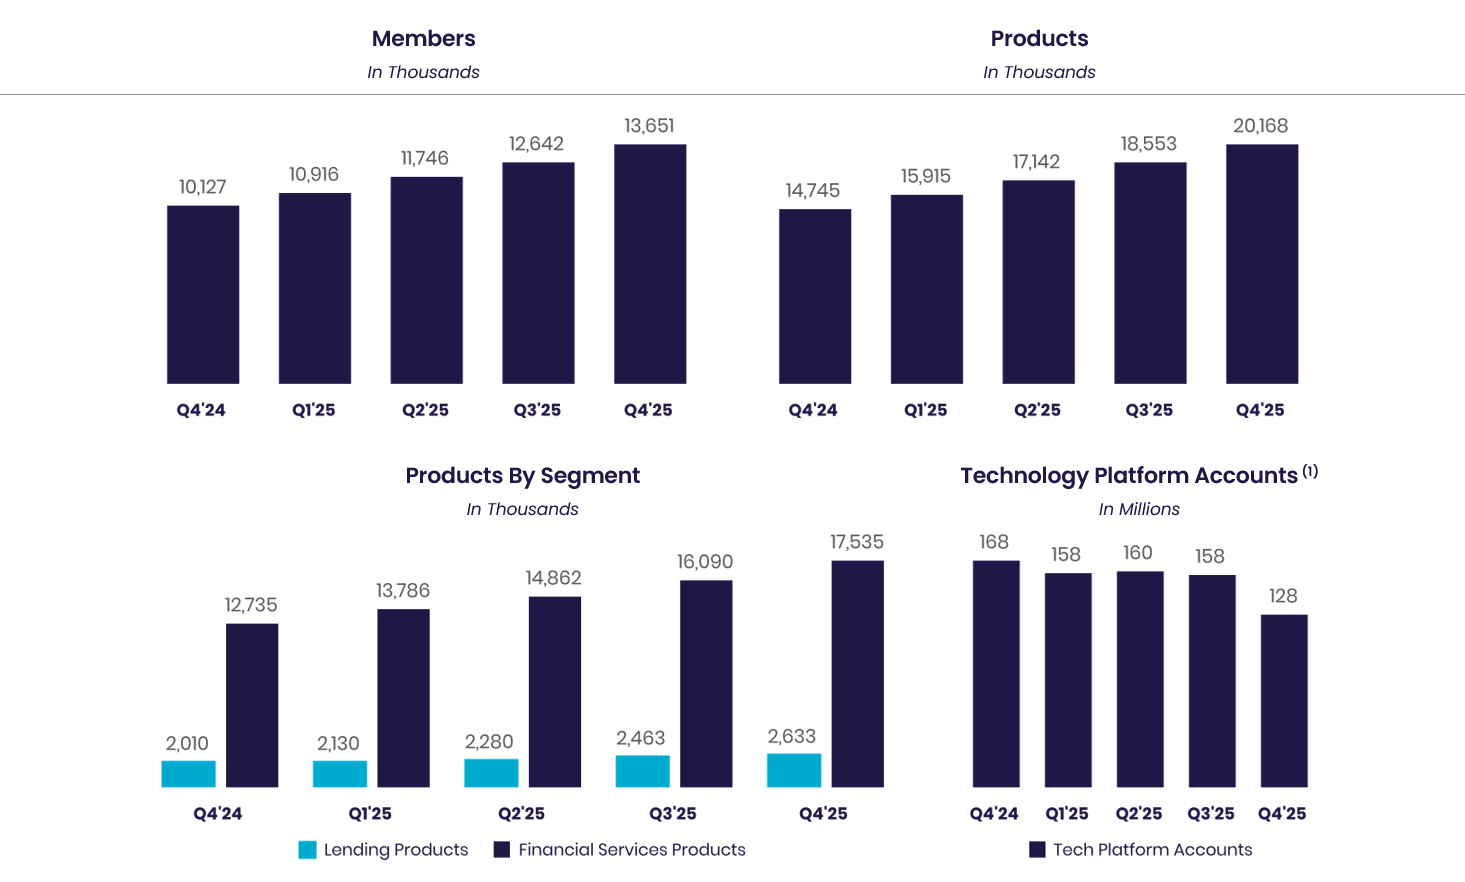
Member growth up 35% to a record 13.7 million members
Product growth up 37% to a record 20.2 million products
Management announces 2026 guidance and medium term outlook
SAN FRANCISCO--(BUSINESS WIRE)--SoFi Technologies, Inc. (NASDAQ: SOFI), a member-centric, one-stop shop for digital financial services that helps members borrow, save, spend, invest and protect their money, reported financial results today for its fourth quarter and fiscal year ended December 31, 2025.
“2025 was a tremendous year and the fourth quarter was nothing short of exceptional, delivering more than $1 billion in quarterly revenue for the first time in our history,” said Anthony Noto, CEO of SoFi. “Our one-stop shop is scaling exactly as intended and delivering a winning combination of growth and returns. We added a record 1 million new members this quarter and drove record product growth. At the same time, we moved with urgency to lead the next phase of financial services by delivering crypto and blockchain innovation backed by bank-grade stability and security. This combination of scale, innovation, and profitability positions SoFi to drive durable, compounding growth, and deliver superior financial returns in 2026 and for years to come.”
Consolidated Results Summary | ||||||||||||||||||
|
|
Three Months Ended
|
| % Change |
|
Year Ended
|
| % Change | ||||||||||
($ in thousands, except per share amounts) |
| 2025 |
| 2024 |
|
| 2025 |
| 2024 |
| ||||||||
Consolidated – GAAP |
|
|
|
|
|
|
|
|
|
|
|
| ||||||
Total net revenue |
| $ | 1,025,051 |
| $ | 734,125 |
| 40 | % |
| $ | 3,613,354 |
| $ | 2,674,859 |
| 35 | % |
Net income |
|
| 173,549 |
|
| 332,473 |
| (48 | )% |
|
| 481,320 |
|
| 498,665 |
| (3 | )% |
Net income attributable to common stockholders – diluted |
|
| 173,893 |
|
| 332,473 |
| (48 | )% |
|
| 482,700 |
|
| 434,776 |
| 11 | % |
Earnings per share attributable to common stockholders – diluted |
| $ | 0.13 |
| $ | 0.29 |
| (55 | )% |
| $ | 0.39 |
| $ | 0.39 |
| — | % |
Consolidated – Non-GAAP(1) |
|
|
|
|
|
|
|
|
|
|
|
| ||||||
Adjusted net revenue |
| $ | 1,012,835 |
| $ | 739,112 |
| 37 | % |
| $ | 3,591,411 |
| $ | 2,606,170 |
| 38 | % |
Adjusted EBITDA |
|
| 317,597 |
|
| 197,957 |
| 60 | % |
|
| 1,053,898 |
|
| 666,480 |
| 58 | % |
Adjusted net income |
|
| 173,549 |
|
| 61,030 |
| 184 | % |
|
| 481,320 |
|
| 227,222 |
| 112 | % |
Adjusted net income attributable to common stockholders – diluted |
|
| 173,893 |
|
| 61,030 |
| 185 | % |
|
| 482,700 |
|
| 163,333 |
| 196 | % |
Adjusted earnings per share – diluted |
| $ | 0.13 |
| $ | 0.05 |
| 160 | % |
| $ | 0.39 |
| $ | 0.15 |
| 160 | % |
| (1) | For more information and reconciliations of these non-GAAP measures to the most comparable GAAP measures, see “Non-GAAP Financial Measures” and Table 2 to the “Financial Tables” herein. |
Product Highlights
- Delivering the Largest New Members and Products Increase in Company History. SoFi added a record 1.0 million new members in the fourth quarter, leading to a 35% year-over-year increase to 13.7 million members and added a record 1.6 million new products in the fourth quarter, up 37% from the prior year to 20.2 million products.
- Achieving Record Revenue and Increased Profitability. Quarterly Adjusted Net Revenue surpassed $1 billion for the first time in company history, reaching $1.013 billion, up 37% year-over-year. SoFi demonstrated the strength of its diversified business by achieving a Rule of 401 score of 68%, reaching record Adjusted EBITDA of $318 million, up 60% year-over-year, representing a 31% Adjusted EBITDA margin.
- Accelerating Growth and Visibility of SoFi's One-Stop Shop. SoFi’s one-stop shop drove exceptional cross-buy, with 40% of new products opened by existing members - a nearly 7-percentage point increase year-over-year. This strength was supported by continued investment in brand building, which drove SoFi's unaided brand awareness to an all-time high of 9.6%.
- Demonstrating Successful Diversification with Record Fee-Based Revenue. Total fee-based revenue across the business surged to a record of $443 million, up more than 50% year-over-year, now generating nearly $1.8 billion on an annualized basis. This was driven by the strong performance of the Loan Platform Business (LPB), which generated $194 million in adjusted net revenue, up 15% from the third quarter and 2.9x from the prior year. LPB is now running at an annualized pace of $15 billion of originations and $774.6 million of high-margin, high-return revenue.
- Leading the Way in Bank-Grade Crypto Innovation. In the fourth quarter, SoFi became the first nationally chartered bank to launch crypto trading for consumers and to launch its own stablecoin, SoFiUSD, on public, permissionless blockchain. SoFi also delivered blockchain-powered international remittances across 30+ countries. These innovations improved money-movement capabilities and established SoFi’s position as the first company providing crypto and blockchain products backed by the bank-grade safety and stability of a nationally chartered bank.
- Increasing Loan Originations to Record-Highs. Total originations reached a record of $10.5 billion in the fourth quarter, up 46% year-over-year. This record was driven by strong performance across all lending segments with record personal loan originations of $7.5 billion, up 43% year-over-year, student loan originations of $1.9 billion, up 38% year-over-year, and record home loan originations of over $1.1 billion, up nearly 2x year-over-year.
- Strong and Consistent Credit Performance. Credit performance remained in-line with expectations, with personal-loan charge-offs down 57 basis points year-over-year and demonstrated continued resilience across a diversified portfolio.
1 | Rule of 40 is calculated as the quarterly year-over-year change in adjusted net revenue plus quarterly adjusted EBITDA margin. Adjusted net revenue and adjusted EBITDA margin are non-GAAP financial measures. See “Non-GAAP Financial Measures” section for detailed explanations and definitions. |
Consolidated Results
SoFi reported a number of record financial achievements. For the fourth quarter of 2025, record GAAP net revenue of $1.0 billion increased 40% relative to the prior-year period's $734.1 million. Record adjusted net revenue of $1.0 billion grew 37% from the corresponding prior-year period of $739.1 million.
For the fourth quarter of 2025, total fee-based revenue reached a record of $443.3 million, a year-over-year increase of 53%. This was driven by strong performance from our Loan Platform Business, as well as referral fee revenue, interchange fee revenue and brokerage fee revenue. Together, the Financial Services and Technology Platform segments generated $579.1 million of net revenue, an increase of 61% from the prior year period.
Net interest income of $617.3 million for the fourth quarter was up 31% year-over-year. This was driven by a 35% increase in average interest-earning assets and a 50 basis point decrease in cost of funds, partially offset by a 74 basis point decrease in average asset yields year-over-year. For the fourth quarter, net interest margin of 5.72% decreased 19 basis points year-over-year from 5.91%, including a modest mix shift from personal loans to home and student loans.
The average rate paid on deposits in the fourth quarter was 181 basis points lower than that paid on warehouse facilities, which translates to approximately $679.8 million of annualized interest expense savings due to the successful remixing of our funding base. In the fourth quarter, SoFi used a portion of the proceeds from its public offering to fully pay down outstanding warehouse lines.
Fourth quarter record adjusted EBITDA of $317.6 million increased 60% from the prior year period's $198.0 million. This represents an adjusted EBITDA margin of 31%. All three segments delivered strong contribution profit, at attractive margins.
SoFi reported its ninth consecutive quarter of GAAP profitability. For the fourth quarter of 2025, GAAP net income reached $173.5 million and diluted earnings per share reached $0.13.
Equity grew by $1.7 billion during the quarter to $10.5 billion and $8.26 of book value per share. Tangible book value grew by $1.7 billion during the quarter, ending the period at $8.9 billion. These increases included the benefit of $1.5 billion of new capital. Tangible book value per share was $7.01 at quarter-end, up from $4.47 per share in the prior year period.
Member and Product Growth
Continued growth in both total members and products in the fourth quarter is the result of our continued investments in innovation and brand building and reflects the benefits of our broad product suite and unique Financial Services Productivity Loop (FSPL) strategy.
SoFi added a record 1,027,000 members in the fourth quarter of 2025, bringing total members to 13.7 million, up 35% from 10.1 million at the end of the same prior year period.
SoFi also achieved record product additions of 1.6 million in the fourth quarter of 2025, bringing total products to nearly 20.2 million, up 37% from 14.7 million at the end of the same prior year period. Financial Services products increased by 38% year-over-year to 17.5 million, primarily driven by continued demand for our SoFi Money, Relay and Invest products, and drove 89% of our total product growth.
Financial Services products increased by 38% year-over-year to 17.5 million, primarily driven by continued demand for our SoFi Money, Relay and Invest products, and drove 89% of our total product growth.
Lending products increased by 31% year-over-year to 2.6 million, driven by continued demand for personal, student, and home loan products.
Technology Platform enabled accounts decreased 23% year-over-year to 128 million. This includes the impact from a large client which fully transitioned off the platform prior to year-end.
Financial Services Segment Results
For the fourth quarter of 2025, Financial Services segment net revenue of $456.7 million increased 78% from the prior year period. Noninterest income of $248.9 million increased nearly 2.6x year-over-year. Net interest income of $207.8 million increased 30% year-over-year, primarily driven by growth in consumer deposits.
In the fourth quarter, SoFi's Loan Platform Business added $193.7 million to our consolidated adjusted net revenue. Of this, $190.9 million was driven by $3.7 billion of personal loans originated on behalf of third parties as well as referrals to third parties.
In addition to our Loan Platform Business, SoFi continued to see healthy growth in interchange fee revenue in the fourth quarter, up 66% year-over-year, as a result of over $22 billion in total annualized spend in the quarter across SoFi Money and Credit Card.
Contribution profit for the fourth quarter of 2025 reached $230.8 million, a $115.9 million improvement over the prior year period, while contribution margin grew 6 percentage points year-over-year to 51%. This is a reflection of the strong operating leverage generated in the segment by net revenue growth of 78% with directly attributable expenses increasing only 64%.
Financial Services – Segment Results of Operations | ||||||||||||||||||||||
|
|
Three Months Ended
|
|
|
|
Year Ended
|
|
| ||||||||||||||
($ in thousands) |
| 2025 |
| 2024 |
| % Change |
| 2025 |
| 2024 |
| % Change | ||||||||||
Net interest income |
| $ | 207,810 |
|
| $ | 160,337 |
|
| 30 | % |
| $ | 777,991 |
|
| $ | 573,422 |
|
| 36 | % |
Noninterest income |
|
| 248,931 |
|
|
| 96,183 |
|
| 159 | % |
|
| 764,025 |
|
|
| 248,089 |
|
| 208 | % |
Total net revenue – Financial Services |
|
| 456,741 |
|
|
| 256,520 |
|
| 78 | % |
|
| 1,542,016 |
|
|
| 821,511 |
|
| 88 | % |
Provision for credit losses |
|
| (5,460 | ) |
|
| (6,852 | ) |
| (20 | )% |
|
| (30,329 | ) |
|
| (31,659 | ) |
| (4 | )% |
Directly attributable expenses |
|
| (220,493 | ) |
|
| (134,813 | ) |
| 64 | % |
|
| (718,778 | ) |
|
| (482,845 | ) |
| 49 | % |
Contribution profit – Financial Services |
| $ | 230,788 |
|
| $ | 114,855 |
|
| 101 | % |
| $ | 792,909 |
|
| $ | 307,007 |
|
| 158 | % |
Contribution margin – Financial Services(1) |
|
| 51 | % |
|
| 45 | % |
|
|
|
| 51 | % |
|
| 37 | % |
|
| ||
| (1) | Contribution margin is defined for each of our reportable segments as contribution profit divided by net revenue. |
By continuously innovating with new and relevant offerings, features and rewards for members, SoFi grew total Financial Services products by 4.8 million, or 38%, year-over-year, bringing the total to 17.5 million at quarter-end. SoFi Money reached 6.8 million products, Relay reached 6.7 million products and SoFi Invest reached 3.2 million products by the end of the fourth quarter.
Monetization continues to improve with annualized revenue per product of $104 during the fourth quarter, up 29% year-over-year.
In the fourth quarter of 2025, total deposits grew $4.6 billion to $37.5 billion, driven primarily by member deposits.
Financial Services – Products |
| December 31, |
|
| |||
|
| 2025 |
| 2024 |
| % Change | |
Money(1) |
| 6,791,108 |
| 5,094,785 |
| 33 | % |
Invest |
| 3,244,143 |
| 2,525,059 |
| 28 | % |
Credit Card |
| 435,722 |
| 279,360 |
| 56 | % |
Referred loans(2) |
| 149,872 |
| 85,205 |
| 76 | % |
Relay |
| 6,687,259 |
| 4,636,755 |
| 44 | % |
At Work |
| 163,411 |
| 113,917 |
| 43 | % |
Crypto(3) |
| 63,441 |
| — |
| n/m |
|
Total financial services products |
| 17,534,956 |
| 12,735,081 |
| 38 | % |
| (1) | Includes checking and savings accounts held at SoFi Bank, and cash management accounts. | |
(2) | Limited to loans wherein we provide third party fulfillment services as part of our Loan Platform Business. | |
(3) | Product counts for Crypto for the fourth quarter of 2025 reflect activity from our product launch on December 22, 2025 through December 31, 2025 and are therefore not representative of a full quarter of performance. |
Technology Platform Segment Results
Technology Platform segment net revenue of $122.4 million for the fourth quarter of 2025 increased 19% year-over-year. Contribution profit of $47.9 million reflected a contribution margin of 39%.
Technology Platform – Segment Results of Operations | ||||||||||||||||||||||
|
|
Three Months Ended
|
|
|
|
Year Ended
|
|
| ||||||||||||||
($ in thousands) |
| 2025 |
| 2024 |
| % Change |
| 2025 |
| 2024 |
| % Change | ||||||||||
Net interest income |
| $ | 394 |
|
| $ | 473 |
|
| (17 | )% |
| $ | 1,505 |
|
| $ | 2,158 |
|
| (30 | )% |
Noninterest income |
|
| 121,979 |
|
|
| 102,362 |
|
| 19 | % |
|
| 448,706 |
|
|
| 393,020 |
|
| 14 | % |
Total net revenue – Technology Platform |
|
| 122,373 |
|
|
| 102,835 |
|
| 19 | % |
|
| 450,211 |
|
|
| 395,178 |
|
| 14 | % |
Directly attributable expenses |
|
| (74,439 | ) |
|
| (70,728 | ) |
| 5 | % |
|
| (305,798 | ) |
|
| (268,223 | ) |
| 14 | % |
Contribution profit |
| $ | 47,934 |
|
| $ | 32,107 |
|
| 49 | % |
| $ | 144,413 |
|
| $ | 126,955 |
|
| 14 | % |
Contribution margin – Technology Platform(1) |
|
| 39 | % |
|
| 31 | % |
|
|
|
| 32 | % |
|
| 32 | % |
|
| ||
| (1) | Contribution margin is defined for each of our reportable segments as contribution profit divided by net revenue. |
Technology Platform total enabled client accounts decreased 23% year-over-year, to 128.5 million down from 167.7 million in the prior-year period. This includes the impact from a large client which fully transitioned off the platform prior to year-end.
Technology Platform |
| December 31, |
|
| |||
|
| 2025 |
| 2024 |
| % Change | |
Total accounts |
| 128,461,873 |
| 167,713,818 |
| (23 | )% |
Lending Segment Results
For the fourth quarter of 2025, Lending segment GAAP net revenue of $498.7 million increased 19% from the prior year period, while adjusted net revenue for the segment of $486.5 million increased 15% from the prior year period.
Lending segment performance in the fourth quarter was driven by net interest income, which rose 29% year-over-year, primarily driven by growth in average loan balances of 35%.
Lending segment fourth quarter contribution profit of $271.7 million was up 10% from $246.0 million in the corresponding prior-year period. Lending segment adjusted contribution margin was strong at 56%. This strong performance reflects our ability to capitalize on continued strong demand for our lending products.
Lending – Segment Results of Operations | ||||||||||||||||||||||
|
|
Three Months Ended
|
|
|
|
Year Ended
|
|
| ||||||||||||||
($ in thousands) |
| 2025 |
| 2024 |
| % Change |
| 2025 |
| 2024 |
| % Change | ||||||||||
Net interest income |
| $ | 444,763 |
|
| $ | 345,210 |
|
| 29 | % |
| $ | 1,606,032 |
|
| $ | 1,207,226 |
|
| 33 | % |
Noninterest income |
|
| 53,919 |
|
|
| 72,586 |
|
| (26 | )% |
|
| 242,917 |
|
|
| 277,996 |
|
| (13 | )% |
Total net revenue – Lending |
|
| 498,682 |
|
|
| 417,796 |
|
| 19 | % |
|
| 1,848,949 |
|
|
| 1,485,222 |
|
| 24 | % |
Servicing rights – change in valuation inputs or assumptions |
|
| (12,224 | ) |
|
| 4,962 |
|
| n/m |
|
|
| (22,013 | ) |
|
| (6,280 | ) |
| 251 | % |
Residual interests classified as debt – change in valuation inputs or assumptions |
|
| 8 |
|
|
| 25 |
|
| (68 | )% |
|
| 70 |
|
|
| 108 |
|
| (35 | )% |
Directly attributable expenses |
|
| (214,811 | ) |
|
| (176,825 | ) |
| 21 | % |
|
| (810,106 | ) |
|
| (588,507 | ) |
| 38 | % |
Contribution profit – Lending |
| $ | 271,655 |
|
| $ | 245,958 |
|
| 10 | % |
| $ | 1,016,900 |
|
| $ | 890,543 |
|
| 14 | % |
Contribution margin – Lending(1) |
|
| 54 | % |
|
| 59 | % |
|
|
|
| 55 | % |
|
| 60 | % |
|
| ||
|
|
|
|
|
|
|
|
|
|
|
|
| ||||||||||
Adjusted net revenue – Lending (non-GAAP)(2) |
| $ | 486,466 |
|
| $ | 422,783 |
|
| 15 | % |
| $ | 1,827,006 |
|
| $ | 1,479,050 |
|
| 24 | % |
Adjusted contribution margin – Lending (non-GAAP)(2) |
|
| 56 | % |
|
| 58 | % |
|
|
|
| 56 | % |
|
| 60 | % |
|
| ||
| (1) | Contribution margin is defined for each of our reportable segments as contribution profit divided by net revenue. | |
(2) | For more information and a reconciliation of these non-GAAP financial measures to the most comparable GAAP measure, see “Non-GAAP Financial Measures” and Table 2 to the “Financial Tables” herein. | |
Lending – Loans At Fair Value |
|
|
|
|
|
|
| ||||
($ in thousands) | Personal Loans |
| Student Loans |
| Home Loans |
| Total | ||||
December 31, 2025 |
|
|
|
|
|
|
| ||||
Unpaid principal | $ | 20,243,217 |
| $ | 12,875,440 |
| $ | 1,133,329 |
| $ | 34,251,986 |
Accumulated interest |
| 151,079 |
|
| 58,277 |
|
| 4,888 |
|
| 214,244 |
Cumulative fair value adjustments(1) |
| 1,146,372 |
|
| 723,861 |
|
| 66,898 |
|
| 1,937,131 |
Total fair value of loans(2)(3) | $ | 21,540,668 |
| $ | 13,657,578 |
| $ | 1,205,115 |
| $ | 36,403,361 |
September 30, 2025 |
|
|
|
|
|
|
| ||||
Unpaid principal | $ | 19,456,198 |
| $ | 11,143,322 |
| $ | 713,727 |
| $ | 31,313,247 |
Accumulated interest |
| 141,384 |
|
| 49,228 |
|
| 2,730 |
|
| 193,342 |
Cumulative fair value adjustments(1) |
| 1,118,035 |
|
| 635,437 |
|
| 40,260 |
|
| 1,793,732 |
Total fair value of loans(2)(3) | $ | 20,715,617 |
| $ | 11,827,987 |
| $ | 756,717 |
| $ | 33,300,321 |
| (1) | During the three months ended December 31, 2025, the cumulative fair value adjustments for personal loans were impacted by a higher unpaid principal balance, a lower weighted average discount rate and a lower weighted average conditional prepayment rate, partially offset by a higher weighted average annual default rate. The lower discount rate was primarily driven by an 8 basis point decrease in benchmark rates. The cumulative fair value adjustments for student loans were impacted by a higher unpaid principal balance, a lower weighted average discount rate, and a lower weighted average conditional prepayment rate, partially offset by lower weighted average coupon and higher weighted average default rate. | |
(2) | Each component of the fair value of loans is impacted by charge-offs during the period. Our fair value assumption for annual default rate incorporates fair value markdowns on loans beginning when they are 10 days or more delinquent, with additional markdowns at 30, 60 and 90 days past due. | |
(3) | Student loans are classified as loans held for investment, and personal loans and home loans are classified as loans held for sale. |
The following table summarizes the significant inputs to the fair value model for personal and student loans:
| Personal Loans |
| Student Loans | |||||||||
| December 31, 2025 |
| September 30, 2025 |
| December 31, 2025 |
| September 30, 2025 | |||||
Weighted average coupon rate(1) | 13.11 | % |
| 13.11 | % |
| 5.87 | % |
| 5.89 | % | |
Weighted average annual default rate | 4.46 | % |
| 4.33 | % |
| 0.68 | % |
| 0.67 | % | |
Weighted average conditional prepayment rate | 26.87 | % |
| 26.90 | % |
| 11.21 | % |
| 11.27 | % | |
Weighted average discount rate | 4.46 | % |
| 4.55 | % |
| 3.89 | % |
| 3.90 | % | |
Benchmark rate(2) | 3.31 | % |
| 3.39 | % |
| 3.40 | % |
| 3.35 | % | |
(1) | Represents the average coupon rate on loans held on balance sheet, weighted by unpaid principal balance outstanding at the balance sheet date. | |
(2) | Corresponds with two-year SOFR for personal loans, and four-year SOFR for student loans. |
For the fourth quarter of 2025, record origination volume of $10.5 billion increased 46% year-over-year. This was a result of continued strong member demand for personal loans, student loans and home loans as well as strong demand from capital markets partners.
Record personal loan originations of $7.5 billion in the fourth quarter of 2025 were up 43% year-over-year, inclusive of $3.7 billion originated on behalf of third parties through our Loan Platform Business. Fourth quarter student loan volume of $1.9 billion was up 38% year-over-year. Home equity loan originations were strong during the fourth quarter, accounting for nearly one-third of total home loan volume. In total, home loan volume was $1.1 billion, an increase of 95% year-over-year.
Capital markets activity in the fourth quarter of 2025 was very strong. Overall, SoFi sold, or transferred through our Loan Platform Business, more than $4.5 billion in total of personal loans and home loans. In terms of personal loans, we closed $99.8 million of sales in whole loan form at a blended execution of 106.5%. In terms of home loan sales, we closed $691.7 million at a blended execution of 102.3%.
In addition to our personal and home loan sales, SoFi executed a $463 million co-contributor securitization of loans previously originated through our Loan Platform Business. This was the fourth securitization of new collateral under our SoFi Consumer Loan Program (SCLP) since 2021 using collateral originated in the Loan Platform Business. Importantly, this channel provides our partners with meaningful liquidity to support their ongoing investment in the Loan Platform Business. The transaction priced at industry-leading cost-of-funds levels, with a weighted average spread of 101 basis points.
Credit performance remained strong in the fourth quarter, in-line with expectations. The personal loan annualized charge-off rate increased to 2.80% from 2.60% in the prior quarter, including the impact of asset sales, new originations and delinquency sales in the quarter. This increase was driven by portfolio seasoning rather than credit deterioration. Personal loan annualized net charge offs decreased 57 basis points year-over-year.
Had SoFi not sold late stage delinquent loans, it is estimated that, including recoveries, the all-in annualized net charge-off rate for personal loans would have been approximately 4.4% versus 4.2% in the prior quarter.
The student loan annualized charge-off rate increased to 76 basis points from 69 basis points in the prior quarter, driven by seasonality and the impact from a student loan repurchase that concluded during the fourth quarter.
The on-balance sheet 90-day delinquency rates for both personal loans and student loans were consistent with the prior year.
The data continues to support a 7–8% maximum cumulative net loss assumption for personal loans, in line with SoFi's underwriting tolerance.
Recent vintages, originated from the fourth quarter of 2022 to first quarter of 2025 have net cumulative losses of 4.55%, with 37% unpaid principal balance remaining. This is well below the 6.27% observed at the same point in time for the 2017 vintage which is the last vintage that approached our 7-8% tolerance. The gap between the newer cohort curve and the 2017 cohort curve improved by 8 basis points, after improving 29 basis points last quarter, demonstrating continued improvement.
Over the medium term, management expects to deliver compounded annual growth in adjusted net revenue of at least 30% from 2025 to 2028. Additionally, management expects to deliver compounded annual growth in adjusted earnings per share of 38% to 42% from 2025 to 2028. This guidance assumes there are no meaningful changes in the macroeconomic environment and no significant new business launches or acquisitions.
Additionally, of the first quarter of 2020 through the third quarter of 2025 originations, 60% of principal has already been paid down, with 6.8% in net cumulative losses. Therefore, for life-of-loan losses on this entire cohort of loans to reach 8%, the charge-off rate on the remaining 40% of unpaid principal would need to be approximately 10%.
Contacts
Investors:
SoFi Investor Relations
IR@sofi.com
Media:
SoFi Media Relations
PR@sofi.com
Read full story here