Adjusted Net Revenue up 38% to a record $950 million
Adjusted EBITDA up 49% to a record $277 million
Fee-based Revenue up 50% to a record $409 million
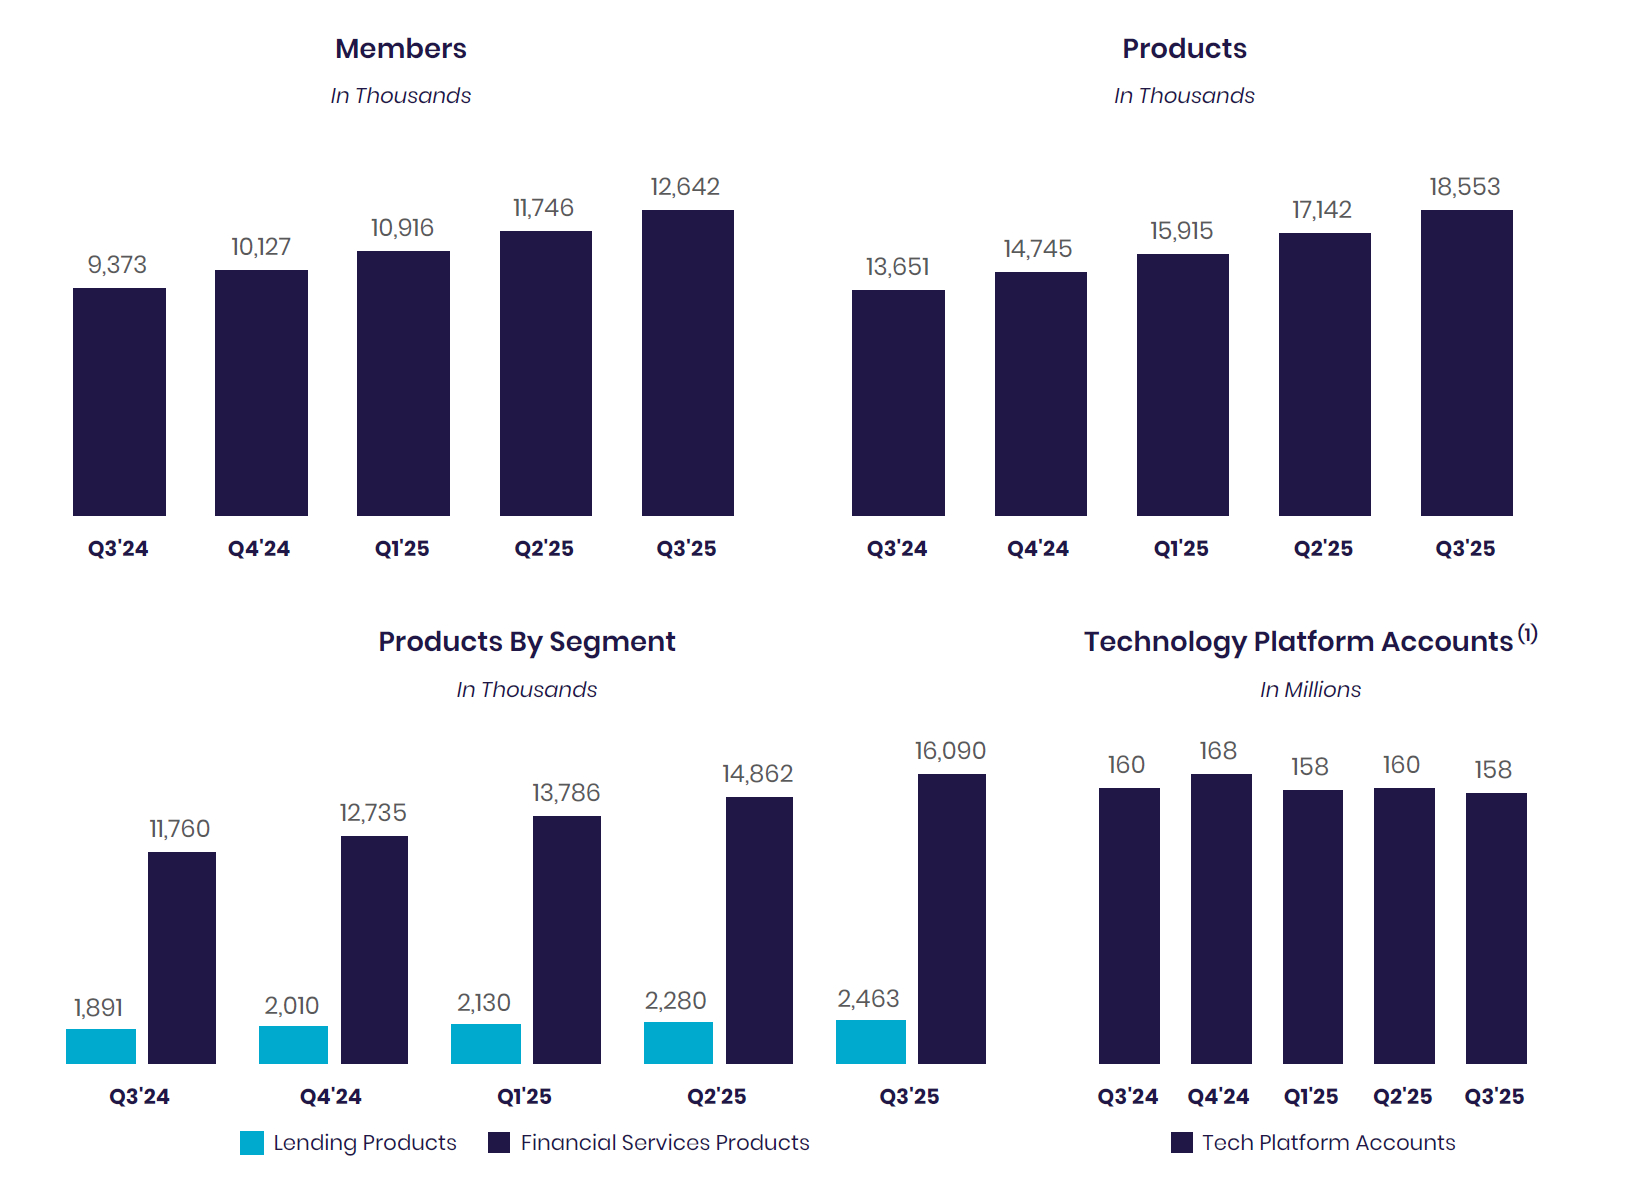
Member growth up 35% to a record 12.6 million members
Product growth up 36% to a record 18.6 million products
Management Raises 2025 Guidance
SAN FRANCISCO--(BUSINESS WIRE)--SoFi Technologies, Inc. (NASDAQ: SOFI), a member-centric, one-stop shop for digital financial services that helps members borrow, save, spend, invest and protect their money, reported financial results today for its third quarter ended September 30, 2025.
“SoFi delivered an exceptional third quarter, fueled by the strength of our innovation and the power of our one-stop shop strategy,” said Anthony Noto, CEO of SoFi.
“We achieved record adjusted net revenue of $950 million and added a record 905,000 new members and 1.4 million new products. Our ability to consistently deliver durable growth, strong returns, and exceptional credit performance proves that our strategy is battle-tested and built to outperform. The opportunity before us is massive and SoFi is executing from a position of unparalleled strength. That’s why we're investing aggressively across the business and accelerating innovation in crypto, blockchain, and AI to help more members than ever before get their money right.”
Consolidated Results Summary | ||||||||||||||||||||||
|
|
Three Months Ended
|
| % Change |
|
Nine Months Ended
|
| % Change | ||||||||||||||
($ in thousands, except per share amounts) |
| 2025 |
| 2024 |
|
| 2025 |
| 2024 |
| ||||||||||||
Consolidated – GAAP |
|
|
|
|
|
|
|
|
|
|
|
| ||||||||||
Total net revenue |
| $ | 961,600 |
|
| $ | 697,121 |
|
| 38 | % |
| $ | 2,588,303 |
|
| $ | 1,940,734 |
|
| 33 | % |
Net income |
|
| 139,392 |
|
|
| 60,745 |
|
| 129 | % |
|
| 307,771 |
|
|
| 166,192 |
|
| 85 | % |
Net income attributable to common stockholders – diluted |
|
| 139,738 |
|
|
| 58,059 |
|
| 141 | % |
|
| 308,807 |
|
|
| 88,928 |
|
| 247 | % |
Earnings per share attributable to common stockholders – diluted |
| $ | 0.11 |
|
| $ | 0.05 |
|
| 120 | % |
| $ | 0.25 |
|
| $ | 0.08 |
|
| 213 | % |
Consolidated – Non-GAAP(1) |
|
|
|
|
|
|
|
|
|
|
|
| ||||||||||
Adjusted net revenue |
| $ | 949,626 |
|
| $ | 689,445 |
|
| 38 | % |
| $ | 2,578,576 |
|
| $ | 1,867,058 |
|
| 38 | % |
Adjusted EBITDA |
|
| 276,881 |
|
|
| 186,237 |
|
| 49 | % |
|
| 736,301 |
|
|
| 468,523 |
|
| 57 | % |
Adjusted net income |
|
| 139,392 |
|
|
| 60,745 |
|
| 129 | % |
|
| 307,771 |
|
|
| 166,192 |
|
| 85 | % |
Adjusted net income attributable to common stockholders – diluted |
|
| 139,738 |
|
|
| 58,059 |
|
| 141 | % |
|
| 308,807 |
|
|
| 88,928 |
|
| 247 | % |
Adjusted earnings per share – diluted |
| $ | 0.11 |
|
| $ | 0.05 |
|
| 120 | % |
| $ | 0.26 |
|
| $ | 0.08 |
|
| 225 | % |
| ____________________ | ||
(1) | For more information and reconciliations of these non-GAAP measures to the most comparable GAAP measures, see “Non-GAAP Financial Measures” and Table 2 to the “Financial Tables” herein. | |
Product Highlights
- Set New Records in Members and Products. A record 905,000 new members joined SoFi in the quarter, up 35% from the prior year to 12.6 million. SoFi added a record 1.4 million new products, up 36% from the prior year to 18.6 million products.
- Delivering Results with SoFi’s One-Stop Shop. SoFi’s integrated financial services model drove strong product adoption across the business. Cross-buy hit its highest level since 2022, with approximately 40% of new products opened by existing SoFi members. This growth was fueled by SoFi’s industry-leading products designed to deliver exceptional value and a seamless experience for members. Innovations including Cash Coach, Level 1 Options, expanded access to alternative investments, and the increasing benefits of SoFi Plus are expected to continue driving momentum and deepen member engagement.
- Demonstrating Successful Diversification and Durable Growth with Record Fee‑Based Revenue. Total fee-based revenue across the business achieved a record $408.7 million, up 50% from the prior year, now generating over $1.6 billion on an annualized basis. This was driven by strong performance from our Loan Platform Business (LPB), which originated $3.4 billion in loans on behalf of third parties in the third quarter and generated $167.9 million in revenue, up 29% from the second quarter and 2.75x from the prior year. LPB is now running at an annualized pace of over $13 billion of originations and $660 million of high-margin, high-return, fee-based revenue.
- Accelerating Loan Originations to Record-Highs. SoFi achieved record total loan originations of $9.9 billion this quarter, up 57% year-over-year, reflecting strong demand across personal, student, and home loans. Personal loan originations reached an all-time high of $7.5 billion while student loan originations increased 58% to $1.5 billion. Home lending set a new record with nearly $945 million in originations, including a record $352 million in home equity loans. This performance was fueled by continuous innovations, including the introduction of interest-only periods for Personal Loans, new step-up repayment options for student loans, and home equity loans.
- Transforming the Future of Finance with Crypto and AI. SoFi launched fast, low-cost international remittances through the blockchain with SoFi Pay. SoFi Crypto will launch later this year and will allow members to buy, sell, and hold dozens of tokens directly in the app. SoFi launched its AI-powered Cash Coach to help members optimize their cash, with further innovations planned in 2026.
- Strengthened Brand Awareness to Attract More Members to SoFi’s Ecosystem. With continued investment to build SoFi into a trusted household name, unaided brand awareness accelerated to an all-time high of 9.1% – an increase of over 4x in just four years.
- Continuing Strength in Credit Performance. SoFi’s annualized charge-off rate decreased by more than 20-basis points for both personal loans and student loans compared to the prior quarter, with personal loan net charge-offs reaching their lowest level in over 2 years. The on-balance sheet 90-day delinquency rate for both personal loans and student loans remained consistent with the prior quarter, increasing just one basis point in the third quarter.
Consolidated Results
SoFi reported a number of key financial achievements. For the third quarter of 2025, GAAP net revenue of $961.6 million increased 38% relative to the prior-year period's $697.1 million. Record adjusted net revenue of $949.6 million grew 38% from the corresponding prior-year period of $689.4 million.
For the third quarter of 2025, total fee-based revenue reached a record of $408.7 million, a year-over-year increase of 50%. This was driven by strong performance from our Loan Platform Business, as well as origination fee revenue, referral fee revenue, interchange fee revenue and brokerage fee revenue. Together, the Financial Services and Technology Platform segments generated $534.2 million of net revenue, an increase of 57% from the prior year period.
Third quarter record adjusted EBITDA of $276.9 million increased 49% from the prior year period's $186.2 million. This represents an adjusted EBITDA margin of 29%. All three segments delivered strong contribution profit, at attractive margins.
SoFi reported its eighth consecutive quarter of GAAP profitability. For the third quarter of 2025, GAAP net income reached $139.4 million and diluted earnings per share reached $0.11.
Equity grew by $1.9 billion during the quarter, ending at $8.8 billion and $7.29 of book value per share. Tangible book value grew by $1.9 billion during the quarter, ending the period at $7.2 billion. Tangible book value per share was $5.97 at quarter-end, up from $4.08 per share in the prior year period.
Net interest income of $585.1 million for the third quarter was up 36% year-over-year. This was driven by a 29% increase in average interest-earning assets and a 76 basis point decrease in cost of funds, partially offset by a 45 basis point decrease in average asset yields year-over-year. For the third quarter, net interest margin of 5.84% increased 27 basis points year-over-year from 5.57%.
The average rate on deposits in the third quarter was 190 basis points lower than that of warehouse facilities, which translates to approximately $627.1 million of annualized interest expense savings due to the successful remixing of our funding base.
Member and Product Growth
Continued growth in both total members and products in the third quarter is the result of our continued investments in innovation and brand building and reflects the benefits of our broad product suite and unique Financial Services Productivity Loop (FSPL) strategy.
SoFi added a record 905,000 members in the third quarter of 2025, bringing total members over 12.6 million, up 35% from 9.4 million at the end of the same prior year period.
SoFi also achieved record product additions of 1.4 million in the third quarter of 2025, bringing total products to nearly 18.6 million, up 36% from 13.7 million at the end of the same prior year period.
Financial Services products increased by 37% year-over-year to 16.1 million, primarily driven by continued demand for our SoFi Money, Relay and Invest products, and drove 88% of our total product growth.
Lending products increased by 30% year-over-year to 2.5 million, driven by continued demand for personal, student, and home loan products.
Technology Platform enabled accounts decreased 1% year-over-year to 158 million.
Financial Services Segment Results
For the third quarter of 2025, Financial Services segment net revenue of $419.6 million increased 76% from the prior year period. Net interest income of $203.7 million increased 32% year-over-year, primarily driven by growth in consumer deposits. Noninterest income of $216.0 million more than doubled year-over-year.
In the third quarter, SoFi's Loan Platform Business added $167.9 million to our consolidated adjusted net revenue. Of this, $164.9 million was driven by $3.4 billion of personal loans originated on behalf of third parties as well as referrals to third parties.
In addition to our Loan Platform Business, SoFi continued to see healthy growth in interchange fee revenue in the third quarter, up 55% year-over-year, as a result of nearly $20 billion in total annualized spend in the quarter across SoFi Money and Credit Card.
Contribution profit for the third quarter of 2025 reached $225.6 million, a $125.8 million improvement from the prior year period, while contribution margin grew 12 percentage points year-over-year to 54%. This is a reflection of the strong operating leverage generated in the segment by net revenue growth of 76% with directly attributable expenses increasing only 39%.
Financial Services – Segment Results of Operations | ||||||||||||||||||||||
|
|
Three Months Ended
|
|
|
|
Nine Months Ended
|
|
| ||||||||||||||
($ in thousands) |
| 2025 |
| 2024 |
| % Change |
| 2025 |
| 2024 |
| % Change | ||||||||||
Net interest income |
| $ | 203,660 |
|
| $ | 154,143 |
|
| 32 | % |
| $ | 570,181 |
|
| $ | 413,085 |
|
| 38 | % |
Noninterest income |
|
| 215,963 |
|
|
| 84,165 |
|
| 157 | % |
|
| 515,094 |
|
|
| 151,906 |
|
| 239 | % |
Total net revenue – Financial Services |
|
| 419,623 |
|
|
| 238,308 |
|
| 76 | % |
|
| 1,085,275 |
|
|
| 564,991 |
|
| 92 | % |
Provision for credit losses |
|
| (9,199 | ) |
|
| (6,008 | ) |
| 53 | % |
|
| (24,869 | ) |
|
| (24,807 | ) |
| — | % |
Directly attributable expenses |
|
| (184,867 | ) |
|
| (132,542 | ) |
| 39 | % |
|
| (498,285 | ) |
|
| (348,032 | ) |
| 43 | % |
Contribution profit – Financial Services |
| $ | 225,557 |
|
| $ | 99,758 |
|
| 126 | % |
| $ | 562,121 |
|
| $ | 192,152 |
|
| 193 | % |
Contribution margin – Financial Services(1) |
|
| 54 | % |
|
| 42 | % |
|
|
|
| 52 | % |
|
| 34 | % |
|
| ||
| ____________________ | ||
(1) | Contribution margin is defined for each of our reportable segments as contribution profit divided by net revenue. | |
By continuously innovating with new and relevant offerings, features and rewards for members, SoFi grew total Financial Services products by 4.3 million, or 37%, year-over-year, bringing the total to 16.1 million at quarter-end. SoFi Money reached 6.3 million products, Relay reached 6.0 million products and SoFi Invest reached 3.0 million products by the end of the third quarter.
Monetization continues to improve with annualized revenue per product of $104 during the third quarter, up 29% year-over-year.
In the third quarter of 2025, total deposits grew $3.4 billion to $32.9 billion, with nearly 90% of SoFi Money deposits (inclusive of Checking and Savings and cash management accounts) coming from direct deposit members.
Financial Services – Products |
| September 30, |
|
| |||||
|
| 2025 |
| 2024 |
| % Change | |||
Money(1) |
| 6,336,705 |
|
| 4,720,305 |
|
| 34 | % |
Invest |
| 3,045,078 |
|
| 2,394,367 |
|
| 27 | % |
Credit Card |
| 392,008 |
|
| 264,937 |
|
| 48 | % |
Referred loans(2) |
| 135,535 |
|
| 73,090 |
|
| 85 | % |
Relay |
| 6,033,791 |
|
| 4,199,602 |
|
| 44 | % |
At Work |
| 147,348 |
|
| 107,668 |
|
| 37 | % |
Total financial services products |
| 16,090,465 |
|
| 11,759,969 |
|
| 37 | % |
| ____________________ | ||
(1) | Includes checking and savings accounts held at SoFi Bank, and cash management accounts. | |
(2) | Limited to loans wherein we provide third party fulfillment services as part of our Loan Platform Business. | |
Technology Platform Segment Results
Technology Platform segment net revenue of $114.6 million for the third quarter of 2025 increased 12% year-over-year. Contribution profit of $32.4 million reflected a contribution margin of 28%.
Technology Platform – Segment Results of Operations | ||||||||||||||||||||||
|
|
Three Months Ended
|
|
|
|
Nine Months Ended
|
|
| ||||||||||||||
($ in thousands) |
| 2025 |
| 2024 |
| % Change |
| 2025 |
| 2024 |
| % Change | ||||||||||
Net interest income |
| $ | 432 |
|
| $ | 629 |
|
| (31 | )% |
| $ | 1,111 |
|
| $ | 1,685 |
|
| (34 | )% |
Noninterest income |
|
| 114,146 |
|
|
| 101,910 |
|
| 12 | % |
|
| 326,727 |
|
|
| 290,658 |
|
| 12 | % |
Total net revenue – Technology Platform |
|
| 114,578 |
|
|
| 102,539 |
|
| 12 | % |
|
| 327,838 |
|
|
| 292,343 |
|
| 12 | % |
Directly attributable expenses |
|
| (82,207 | ) |
|
| (69,584 | ) |
| 18 | % |
|
| (231,359 | ) |
|
| (197,495 | ) |
| 17 | % |
Contribution profit |
| $ | 32,371 |
|
| $ | 32,955 |
|
| (2 | )% |
| $ | 96,479 |
|
| $ | 94,848 |
|
| 2 | % |
Contribution margin – Technology Platform(1) |
|
| 28 | % |
|
| 32 | % |
|
|
|
| 29 | % |
|
| 32 | % |
|
| ||
| ____________________ | ||
(1) | Contribution margin is defined for each of our reportable segments as contribution profit divided by net revenue. | |
Technology Platform total enabled client accounts decreased 1% year-over-year, to 157.9 million, down from 160.2 million in the prior-year period.
Technology Platform |
| September 30, |
|
| |||||
|
| 2025 |
| 2024 |
| % Change | |||
Total accounts |
| 157,859,670 |
|
| 160,179,299 |
|
| (1 | )% |
Lending Segment Results
For the third quarter of 2025, Lending segment GAAP net revenue of $493.4 million increased 25% from the prior year period, while adjusted net revenue for the segment of $481.4 million increased 23% from the prior year period.
Lending segment performance in the third quarter was driven by net interest income, which rose 35% year-over-year, primarily driven by growth in average loan balances of 35%.
Lending segment third quarter contribution profit of $261.6 million was up 9% from $238.9 million in the corresponding prior-year period. Lending segment adjusted contribution margin was strong at 54%. This strong performance reflects our ability to capitalize on continued strong demand for our lending products.
Lending – Segment Results of Operations | ||||||||||||||||||||||
|
|
Three Months Ended
|
|
|
|
Nine Months Ended
|
|
| ||||||||||||||
($ in thousands) |
| 2025 |
| 2024 |
| % Change |
| 2025 |
| 2024 |
| % Change | ||||||||||
Net interest income |
| $ | 427,973 |
|
| $ | 316,268 |
|
| 35 | % |
| $ | 1,161,269 |
|
| $ | 862,016 |
|
| 35 | % |
Noninterest income |
|
| 65,409 |
|
|
| 79,977 |
|
| (18 | )% |
|
| 188,998 |
|
|
| 205,410 |
|
| (8 | )% |
Total net revenue – Lending |
|
| 493,382 |
|
|
| 396,245 |
|
| 25 | % |
|
| 1,350,267 |
|
|
| 1,067,426 |
|
| 26 | % |
Servicing rights – change in valuation inputs or assumptions |
|
| (11,989 | ) |
|
| (4,362 | ) |
| 175 | % |
|
| (9,789 | ) |
|
| (11,242 | ) |
| (13 | )% |
Residual interests classified as debt – change in valuation inputs or assumptions |
|
| 15 |
|
|
| 9 |
|
| 67 | % |
|
| 62 |
|
|
| 83 |
|
| (25 | )% |
Directly attributable expenses |
|
| (219,808 | ) |
|
| (152,964 | ) |
| 44 | % |
|
| (595,295 | ) |
|
| (411,682 | ) |
| 45 | % |
Contribution profit – Lending |
| $ | 261,600 |
|
| $ | 238,928 |
|
| 9 | % |
| $ | 745,245 |
|
| $ | 644,585 |
|
| 16 | % |
Contribution margin – Lending(1) |
|
| 53 | % |
|
| 60 | % |
|
|
|
| 55 | % |
|
| 60 | % |
|
| ||
|
|
|
|
|
|
|
|
|
|
|
|
| ||||||||||
Adjusted net revenue – Lending (non-GAAP)(2) |
| $ | 481,408 |
|
| $ | 391,892 |
|
| 23 | % |
| $ | 1,340,540 |
|
| $ | 1,056,267 |
|
| 27 | % |
Adjusted contribution margin – Lending (non-GAAP)(2) |
|
| 54 | % |
|
| 61 | % |
|
|
|
| 56 | % |
|
| 61 | % |
|
| ||
| ____________________ | ||
(1) | Contribution margin is defined for each of our reportable segments as contribution profit divided by net revenue. | |
(2) | For more information and a reconciliation of these non-GAAP financial measures to the most comparable GAAP measure, see “Non-GAAP Financial Measures” and Table 2 to the “Financial Tables” herein. | |
Lending – Loans At Fair Value |
| |||||||||||||||
($ in thousands) | Personal Loans |
| Student Loans |
| Home Loans |
| Total | |||||||||
September 30, 2025 |
|
|
|
|
|
|
| |||||||||
Unpaid principal | $ | 19,456,198 |
|
| $ | 11,143,322 |
|
| $ | 713,727 |
|
| $ | 31,313,247 |
| |
Accumulated interest |
| 141,384 |
|
|
| 49,228 |
|
|
| 2,730 |
|
|
| 193,342 |
| |
Cumulative fair value adjustments(1) |
| 1,118,035 |
|
|
| 635,437 |
|
|
| 40,260 |
|
|
| 1,793,732 |
| |
Total fair value of loans(2)(3) | $ | 20,715,617 |
|
| $ | 11,827,987 |
|
| $ | 756,717 |
|
| $ | 33,300,321 |
| |
June 30, 2025 |
|
|
|
|
|
|
| |||||||||
Unpaid principal | $ | 18,416,674 |
|
| $ | 10,099,685 |
|
| $ | 359,360 |
|
| $ | 28,875,719 |
| |
Accumulated interest |
| 132,100 |
|
|
| 57,581 |
|
|
| 895 |
|
|
| 190,576 |
| |
Cumulative fair value adjustments(1) |
| 1,055,163 |
|
|
| 584,375 |
|
|
| 17,137 |
|
|
| 1,656,675 |
| |
Total fair value of loans(2)(3) | $ | 19,603,937 |
|
| $ | 10,741,641 |
|
| $ | 377,392 |
|
| $ | 30,722,970 |
| |
| ____________________ | ||
(1) | During the three months ended September 30, 2025, the cumulative fair value adjustments for personal loans were impacted by a higher unpaid principal balance and a lower weighted average discount rate, partially offset by a lower weighted average coupon, a higher weighted average conditional prepayment rate, and a higher weighted average annual default rate. The lower discount rate was primarily driven by a 10 basis point decrease in benchmark rates. The cumulative fair value adjustments for student loans were impacted by a higher unpaid principal balance, a lower weighted average discount rate, and a lower weighted average conditional prepayment rate, partially offset by lower weighted average coupon. The lower discount rate was driven by a 4 basis point decrease in benchmark rates. | |
(2) | Each component of the fair value of loans is impacted by charge-offs during the period. Our fair value assumption for annual default rate incorporates fair value markdowns on loans beginning when they are 10 days or more delinquent, with additional markdowns at 30, 60 and 90 days past due. | |
(3) | Student loans are classified as loans held for investment, and personal loans and home loans are classified as loans held for sale. | |
The following table summarizes the significant inputs to the fair value model for personal and student loans:
| Personal Loans |
| Student Loans | |||||||||
| September 30, 2025 |
| June 30, 2025 |
| September 30, 2025 |
| June 30, 2025 | |||||
Weighted average coupon rate(1) | 13.11 | % |
| 13.17 | % |
| 5.89 | % |
| 5.98 | % | |
Weighted average annual default rate | 4.33 | % |
| 4.28 | % |
| 0.67 | % |
| 0.67 | % | |
Weighted average conditional prepayment rate | 26.90 | % |
| 26.45 | % |
| 11.27 | % |
| 11.28 | % | |
Weighted average discount rate | 4.55 | % |
| 4.67 | % |
| 3.90 | % |
| 3.97 | % | |
Benchmark rate(2) | 3.39 | % |
| 3.49 | % |
| 3.35 | % |
| 3.39 | % | |
| ____________________ | ||
(1) | Represents the average coupon rate on loans held on balance sheet, weighted by unpaid principal balance outstanding at the balance sheet date. | |
(2) | Corresponds with two-year SOFR for personal loans, and four-year SOFR for student loans. | |
For the third quarter of 2025, record origination volume of $9.9 billion increased 57% year-over-year. This was a result of continued strong member demand for personal loans, student loans and home loans as well as strong demand from capital markets partners.
Record personal loan originations of $7.5 billion in the third quarter of 2025 were up 53% year-over-year, inclusive of $3.4 billion originated on behalf of third parties through our Loan Platform Business. Third quarter student loan volume of $1.5 billion was up 58% year-over-year. Home equity loan originations were a record during the third quarter, accounting for one-third of total home loan volume. In total, home loan volume was $945 million, an increase of 93% year-over-year.
Capital markets activity in the third quarter of 2025 was very strong. Overall, SoFi sold, or transferred through our Loan Platform Business, more than $4.6 billion in total of personal loans, student loans, and home loans. In terms of personal loans, we closed $175.0 million of sales in whole loan form at a blended execution of 106.4%. In terms of student loans, we closed $376.5 million of sales in whole loan form at a blended execution of 105.9%. In terms of home loan sales, we closed $584.8 million at a blended execution of 102.9%.
In addition to our personal, student and home loan sales, SoFi executed a $466 million co-contributor securitization of loans previously originated through our Loan Platform Business. This was the third securitization of new collateral under our SoFi Consumer Loan Program (SCLP) since 2021 using collateral originated in the Loan Platform Business. Importantly, this channel provides our partners with meaningful liquidity to support their ongoing investment in the Loan Platform Business. The transaction priced at industry-leading cost-of-funds levels, with a weighted average spread of 98 basis points.
Credit performance remained strong in the third quarter. The on-balance sheet 90-day delinquency rates for both personal loans and student loans were consistent with the prior quarter.
The personal loan annualized charge-off rate decreased to 2.60% from 2.83% in the prior quarter, including the impact of asset sales, new originations and delinquency sales in the quarter. Had SoFi not sold late stage delinquent loans, it is estimated that, including recoveries, the all-in annualized net charge-off rate for personal loans would have been approximately 4.2% versus 4.5% in the prior quarter.
The data continues to support a 7–8% maximum cumulative net loss assumption for personal loans, in line with SoFi's underwriting tolerance.
Recent vintages, originated from the fourth quarter of 2022 to the fourth quarter of 2024, have net cumulative losses of 4.40%, with 39% unpaid principal balance remaining. This is well below the 6.08% observed at the same point in time for the 2017 vintage which is the last vintage that approached our 7-8% tolerance. The gap between the newer cohort curve and the 2017 cohort curve improved by 29 basis points, after improving 19 basis points last quarter, demonstrating continued improvement.
Additionally, of the first quarter of 2020 through the second quarter of 2025 originations, 60% of principal has already been paid down, with 6.7% in net cumulative losses. Therefore, for life-of-loan losses on this entire cohort of loans to reach 8%, the charge-off rate on the remaining 40% of unpaid principal would need to be approximately 10%. This would be well above past levels, providing further confidence in achieving loss rates below our 8% tolerance.
Lending – Originations and Average Balances | ||||||||||||||||||||||
|
|
Three Months Ended
|
| % Change |
|
Nine Months Ended
|
| % Change | ||||||||||||||
|
| 2025 |
| 2024 |
|
| 2025 |
| 2024 |
| ||||||||||||
Origination volume ($ in thousands, during period) |
|
|
|
|
|
|
|
|
|
|
|
| ||||||||||
Personal loans(1) |
| $ | 7,488,879 |
|
| $ | 4,892,040 |
|
| 53 | % |
| $ | 19,994,466 |
|
| $ | 12,363,036 |
|
| 62 | % |
Student loans |
|
| 1,491,724 |
|
|
| 943,584 |
|
| 58 | % |
|
| 3,676,513 |
|
|
| 2,431,782 |
|
| 51 | % |
Home loans |
|
| 944,651 |
|
|
| 489,767 |
|
| 93 | % |
|
| 2,261,290 |
|
|
| 1,242,851 |
|
| 82 | % |
Total |
| $ | 9,925,254 |
|
| $ | 6,325,391 |
|
| 57 | % |
| $ | 25,932,269 |
|
| $ | 16,037,669 |
|
| 62 | % |
Average loan balance ($, as of period end)(2) |
|
|
|
|
|
|
|
|
|
|
|
| ||||||||||
Personal loans |
| $ | 25,964 |
|
| $ | 25,063 |
|
| 4 | % |
|
|
|
|
|
| |||||
Student loans |
|
| 42,211 |
|
|
| 42,713 |
|
| (1 | )% |
|
|
|
|
|
| |||||
Home loans |
|
| 254,660 |
|
|
| 283,948 |
|
| (10 | )% |
|
|
|
|
|
| |||||
| ____________________ | ||
(1) | Inclusive of origination volume related to our Loan Platform Business. | |
(2) | Within each loan product category, average loan balance is defined as the total unpaid principal balance of the loans divided by the number of loans that have a balance greater than zero dollars as of the reporting date. Average loan balance includes loans on our balance sheet, as well as transferred loans and referred loans with which SoFi has continuing involvement through our servicing agreements. | |
Contacts
Investors:
SoFi Investor Relations
IR@sofi.com
Media:
SoFi Media Relations
PR@sofi.com
Read full story here